Tired of tangled processes? Discover the power of Directed Acyclic Graphs (DAGs) to streamline complex workflows. Click to unlock the secrets of this revolutionary data structure and its real-world applications.
What is Directed Acyclic Graph?
A directed acyclic graph (DAG) is a visual way to show the order of a series of activities. It looks like a bunch of circles (vertices), each representing an activity, connected by lines (edges) that show how one activity flows into another. The lines have arrows, indicating a one-way direction of flow. The “acyclic” part means you can’t go in circles—once you move from one activity to the next, you can’t trace a path back to where you started.
Why are Directed Acyclic Graphs useful?
Directed acyclic graphs (DAGs) are valuable for representing various types of flows, particularly in data processing. By visualizing large-scale processing flows as DAGs, the different steps and their order become clearer, aiding in the organization and management of complex data pipelines.
In data processing, a series of computations are often applied to raw data to prepare it for specific uses. This flow, often referred to as a data pipeline, can involve multiple steps such as cleansing, aggregation, enrichment, and transformation. DAGs provide a visual representation of these steps and their dependencies, allowing for better understanding and optimization of the data processing workflow.
Characteristics of DAGs in Stream Processing
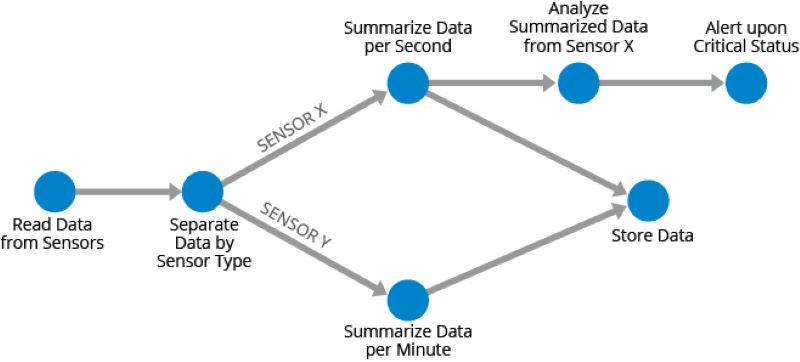
A key characteristic of DAGs in stream processing is their ability to handle multiple pathways within a data flow. This feature accommodates the need to process data differently for various outputs and requirements. For example, in a sensor data stream, data from Sensor X might undergo real-time analysis and alerting if critical statuses are detected, while simultaneously being stored for long-term analysis. In contrast, data from Sensor Y might be summarized per minute before being stored. This multi-path approach within the DAG allows for flexibility and simultaneous execution of different processing tasks on the same data stream.

DAGs in Batch Processing
In batch processing pipelines, DAGs effectively illustrate the dependencies and order of operations. For instance, consider a scenario where a database of global sales needs to be transformed into a report of regional sales in U.S. dollars. The DAG would depict the step-by-step process: loading all data into a processing engine, separating by currency, converting to U.S. dollars, summarizing by region, and finally, generating the final report. Additionally, a separate report specifically for U.S. sales could also be created within the same DAG, showcasing the flexibility of this model in handling multiple outputs.
DAGs are more than just a theoretical concept; they are practical tools that enhance efficiency, scalability, and innovation in fields like data processing, task scheduling, and blockchain technology. Their unique properties and wide-ranging applications make them a crucial component of the modern technological landscape.
Subscribe to the Blockchain Bulletin Weekly newsletter for expert insights, in-depth analysis, and exclusive content on DAG-based innovations and other cutting-edge developments in blockchain technology.

